Understand the Capital Asset Pricing Model (CAPM)
- Nhung Nguyen
- Aug 30
- 8 min read


The Capital Asset Pricing Model (CAPM) is one of the most important concepts in modern finance and investment analysis. It provides a framework for understanding the relationship between risk and expected return and helps investors determine whether the return they expect from an investment adequately compensates them for the risk they are taking.
CAPM is widely used in portfolio management, corporate finance, valuation, investment banking, and financial modelling. It is also a fundamental topic for professional finance qualifications such as CFA.
This article explains CAPM from the fundamentals through to practical applications, assumptions, limitations, and examples.
1. What Is the Capital Asset Pricing Model?
The Capital Asset Pricing Model (CAPM) is a financial model that estimates the expected return of an investment based on its systematic risk relative to the overall market.
The central idea is:
Investors should receive compensation for the time value of money and for taking systematic investment risk.
CAPM distinguishes between two broad types of risk:
Systematic risk – risk that affects the entire market and cannot be eliminated through diversification.
Unsystematic risk – company-specific risk that can largely be eliminated through diversification.
CAPM focuses specifically on systematic risk.
The model was developed primarily through the work of William Sharpe, Harry Markowitz, John Lintner, and Jan Mossin and became a cornerstone of modern portfolio theory.
2. The CAPM Formula

3. Understanding the Risk-Free Rate
The risk-free rate represents the return an investor could theoretically earn without taking meaningful investment risk.
In practice, investors generally use the yield on a high-quality government security as a proxy for the risk-free rate.
For example, when valuing a company in the United States, analysts may use the yield on a U.S. Treasury security with a maturity consistent with the valuation horizon.
The choice of risk-free rate should be consistent with:
The currency of the cash flows
The investment horizon
The valuation framework
The economic environment
For example, if a company's cash flows are forecast in GBP, using a GBP-based risk-free rate is generally more appropriate than using a USD risk-free rate.
4. What Is Beta?
Beta (β\beta) measures how sensitive an investment's returns are to movements in the overall market.
It is one of the most important components of CAPM.
Conceptually:

Beta therefore measures the investment's systematic risk relative to the market.
Interpreting Beta
Beta | Interpretation |
0 | No systematic relationship with the market |
0.5 | Approximately half as sensitive as the market |
1.0 | Similar systematic risk to the market |
1.5 | Approximately 50% more sensitive than the market |
2.0 | Approximately twice as sensitive as the market |
For example, a stock with a beta of 1.5 would theoretically be expected to rise by approximately 15% when the market rises by 10%, and fall by approximately 15% when the market falls by 10%, assuming the relationship is stable.
However, beta is a statistical estimate, not a guarantee of future performance.
5. Understanding the Market Risk Premium
The market risk premium (MRP) represents the additional return investors require for investing in the market rather than in a risk-free asset.

6. A Simple CAPM Example
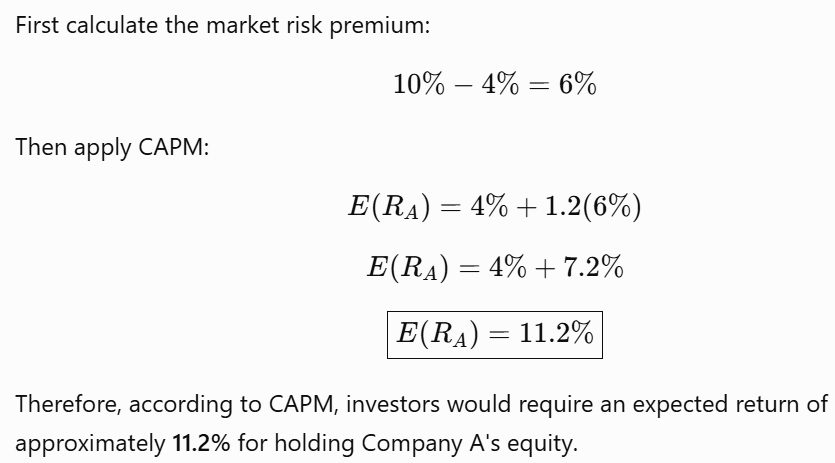
Suppose an investor is evaluating Company A.
Assume:
Risk-free rate = 4%
Expected market return = 10%
Company A's beta = 1.2
7. What Does CAPM Actually Tell Investors?
CAPM essentially answers the question:
What return should an investor require for taking the systematic risk associated with an investment?
The model establishes a relationship between expected return and beta.
An investment with greater systematic risk should generally offer a higher expected return.
For example:
Investment | Beta | Risk-Free Rate | Market Risk Premium | CAPM Return |
A | 0.5 | 4% | 6% | 7% |
B | 1.0 | 4% | 6% | 10% |
C | 1.5 | 4% | 6% | 13% |
D | 2.0 | 4% | 6% | 16% |
The higher the beta, the higher the return required under CAPM.
8. Systematic Risk vs. Unsystematic Risk
Understanding this distinction is essential.
Systematic Risk
Systematic risk affects the broader market or economy.
Examples include:
Inflation
Interest-rate changes
Recessions
Geopolitical shocks
Major regulatory changes
Economy-wide financial crises
Diversification cannot completely eliminate systematic risk.
Unsystematic Risk
Unsystematic risk is specific to an individual company or industry.
Examples include:
CEO resignation
Product failure
Corporate fraud
Factory shutdown
Litigation
Company-specific operational problems
Investors can substantially reduce unsystematic risk through diversification.
Why CAPM Ignores Unsystematic Risk
CAPM assumes investors hold diversified portfolios.
Therefore, investors should not expect additional compensation for risks that can be eliminated through diversification.
This is one of the model's most important theoretical conclusions.
9. The Security Market Line
CAPM can also be represented graphically through the Security Market Line (SML).
The SML shows the relationship between:
Expected return
Systematic risk, measured by beta

Positive alpha may indicate that an investment offers more return than CAPM would require for its systematic risk.
However, alpha can also arise from estimation errors, model limitations, or temporary market conditions.
10. CAPM and the Cost of Equity
One of the most important practical applications of CAPM is estimating a company's cost of equity.

The estimated cost of equity is therefore 11.8%.
11. CAPM in Company Valuation
CAPM is particularly important in Discounted Cash Flow (DCF) valuation.
When valuing a company, analysts often need to determine an appropriate discount rate.
The cost of equity estimated using CAPM can be incorporated into the company's Weighted Average Cost of Capital (WACC).

12. CAPM and Investment Decisions
Investors can use CAPM to compare an investment's expected return with its required return.
Suppose:
CAPM required return = 11%
Investor's expected return = 15%
The investment potentially offers:
15%−11%=4%
of excess expected return.
Conversely, if an investment has an expected return of only 8% against a CAPM-required return of 11%, the investor may conclude that the investment does not adequately compensate for its systematic risk.
CAPM therefore provides a benchmark for evaluating investment opportunities.
13. Key Assumptions of CAPM
CAPM is based on several simplifying assumptions.
1. Investors are rational
Investors are assumed to make decisions based on risk and return.
2. Investors are risk-averse
Given two investments with the same expected return, investors prefer the investment with lower risk.
3. Investors can diversify
Investors can construct diversified portfolios and therefore eliminate most unsystematic risk.
4. Investors have homogeneous expectations
The model assumes investors have broadly similar expectations about:
Expected returns
Risk
Correlations
Market opportunities
5. Markets are frictionless
The traditional model assumes there are no:
Transaction costs
Taxes
Restrictions on trading
Significant information costs
6. Investors can borrow and lend at the risk-free rate
This is a particularly strong assumption and is rarely true in practice.
7. Assets are divisible
Investors can theoretically purchase any fraction of an asset.
14. Advantages of CAPM
Despite its assumptions, CAPM remains widely used.
Simple and intuitive
The model reduces a complicated risk-return relationship to a relatively simple equation.
Focuses on relevant risk
CAPM emphasizes systematic risk, which is particularly important for diversified investors.
Useful for valuation
It provides a practical method for estimating the cost of equity.
Widely accepted
CAPM is commonly incorporated into:
Investment analysis
Corporate finance
DCF models
WACC calculations
Portfolio management
M&A analysis
Provides a common benchmark
CAPM gives analysts a consistent framework for comparing required returns across investments.
15. Limitations of CAPM
CAPM is powerful, but it is not perfect.
15.1 Beta is backward-looking
Historical beta is often used to estimate future systematic risk.
However, a company's future risk may differ substantially from its historical risk.
For example, a company may:
Change its business model
Increase leverage
Enter a new market
Acquire another company
Become significantly larger
Its historical beta may therefore become less representative.
15.2 The market risk premium is difficult to estimate
The expected market return is not directly observable.
Analysts must make assumptions about future returns, creating uncertainty around the market risk premium.
Small changes in the assumed premium can materially affect the calculated cost of equity.
15.3 The risk-free rate can change
Interest rates change over time.
Consequently, the CAPM cost of equity can change even if the company's beta remains constant.
15.4 Real-world markets are not frictionless
Investors face:
Taxes
Transaction costs
Financing constraints
Information asymmetry
Liquidity risk
These factors are not fully incorporated into the traditional CAPM.
15.5 One factor may not explain all returns
CAPM essentially relies on one primary risk factor: market risk.
However, empirical research suggests that other characteristics can influence investment returns, including:
Company size
Value characteristics
Momentum
Profitability
Investment patterns
This led to the development of alternative models such as the Fama-French Three-Factor Model and later multifactor models.
16. CAPM vs. Diversification
A common misconception is:
"A risky investment should always generate a higher return."
CAPM provides a more nuanced answer.
The relevant question is:
How much of the investment's risk cannot be diversified away?
An investment can have significant total volatility but relatively low systematic risk.
Conversely, an investment can have moderate volatility but a high correlation with the overall market.
CAPM therefore focuses on market-related risk rather than total volatility.
17. Levered and Unlevered Beta
In corporate finance, analysts frequently distinguish between levered beta and unlevered beta.
Levered Beta
Levered beta reflects both:
Business risk
Financial leverage
Unlevered Beta
Unlevered beta attempts to measure business risk without the effect of capital structure.

This is particularly useful when estimating beta for a private company or when comparing companies with different capital structures.
18. CAPM for Private Companies
Private companies do not have publicly traded shares, so their beta cannot simply be estimated from their own historical stock-price data.
Analysts often use a bottom-up beta approach.
A simplified process is:
Step 1: Identify comparable public companies
Find publicly traded companies operating in similar industries.
Step 2: Calculate their unlevered betas
Remove the effects of their capital structures.
Step 3: Determine an appropriate industry beta
Calculate or otherwise select a representative unlevered beta.
Step 4: Relever the beta
Adjust the beta based on the target company's capital structure.
Step 5: Apply CAPM
Use the resulting beta to estimate the company's cost of equity.
This approach is commonly used in valuation because it is often more forward-looking than simply relying on historical beta.
19. CAPM Example for a DCF Valuation
Consider a company with the following assumptions:
Risk-free rate = 4%
Unlevered beta = 0.90
Debt-to-equity ratio = 0.50
Corporate tax rate = 20%
Expected market return = 10%

20. CAPM vs. Other Asset Pricing Models
CAPM is not the only asset-pricing framework.
Model | Main Risk Factors |
CAPM | Market risk |
Fama-French 3-Factor | Market, size, value |
Fama-French 5-Factor | Market, size, value, profitability, investment |
APT | Multiple systematic risk factors |
Carhart Model | Market, size, value, momentum |
CAPM remains attractive because of its simplicity.
However, more sophisticated models may provide a richer explanation of expected returns.
21. Common CAPM Mistakes
When applying CAPM, analysts should watch for several common errors.
Mistake 1: Confusing beta with total risk
Beta measures systematic risk, not total investment volatility.
Mistake 2: Using inconsistent currencies
The risk-free rate and market assumptions should be consistent with the currency of the valuation.
Mistake 3: Using an inappropriate beta
A company's historical beta may not accurately reflect its future risk.
Mistake 4: Ignoring leverage
Companies with different capital structures can have materially different equity betas.
Mistake 5: Treating CAPM as an exact prediction
CAPM provides an estimated required return, not a guaranteed future return.
Mistake 6: Double-counting risk
Analysts should be careful not to incorporate the same risk premium both in the cash flows and in the discount rate.
22. A Practical CAPM Checklist
When applying CAPM, consider the following:
Step 1: Determine the appropriate risk-free rate.
Step 2: Estimate the expected market return.
Step 3: Calculate or obtain the market risk premium.
Step 4: Determine an appropriate beta.
Step 5: If necessary, unlever and relever beta.
Step 6: Calculate the cost of equity.
Step 7: Compare the required return with the expected return.
Step 8: If used for valuation, incorporate the cost of equity into the appropriate discount-rate framework.
23. CAPM in One Equation

1. Time value of money
→ Risk-free rate
2. Compensation for market risk
→ Beta × Market risk premium
3. Total required return
→ CAPM expected/required return
24. Final Takeaway
The Capital Asset Pricing Model provides a fundamental framework for understanding how investors should be compensated for taking investment risk.
Its central message is simple:
Investors should be rewarded for systematic risk, not for risks that can be eliminated through diversification.
CAPM connects the risk-free rate, beta, and market risk premium to estimate an investment's required return.
Although its assumptions are unrealistic in several respects and its predictions are not perfect, CAPM remains highly influential because it is simple, intuitive, practical, and deeply embedded in modern financial analysis.
For corporate finance professionals, its importance goes even further:
CAPM → Cost of Equity → WACC → DCF Valuation → Investment Decisions
Understanding this chain is essential for anyone studying or working in finance, investment analysis, valuation, accounting, corporate finance, or portfolio management.
Resources : Internet


Comments